Data Science Team & Tech Lead

Blog

  • Onto Kubernetes – Part 4

    Onto Kubernetes – Part 4

    With the Prometheus-Loki-Grafana stack being deployed, the observability stack has been fully deployed on the Kubernetes cluster. Operational metrics gathered by Prometheus and logs aggregated by Loki are finally fed into the Grafana for easier visualisation.

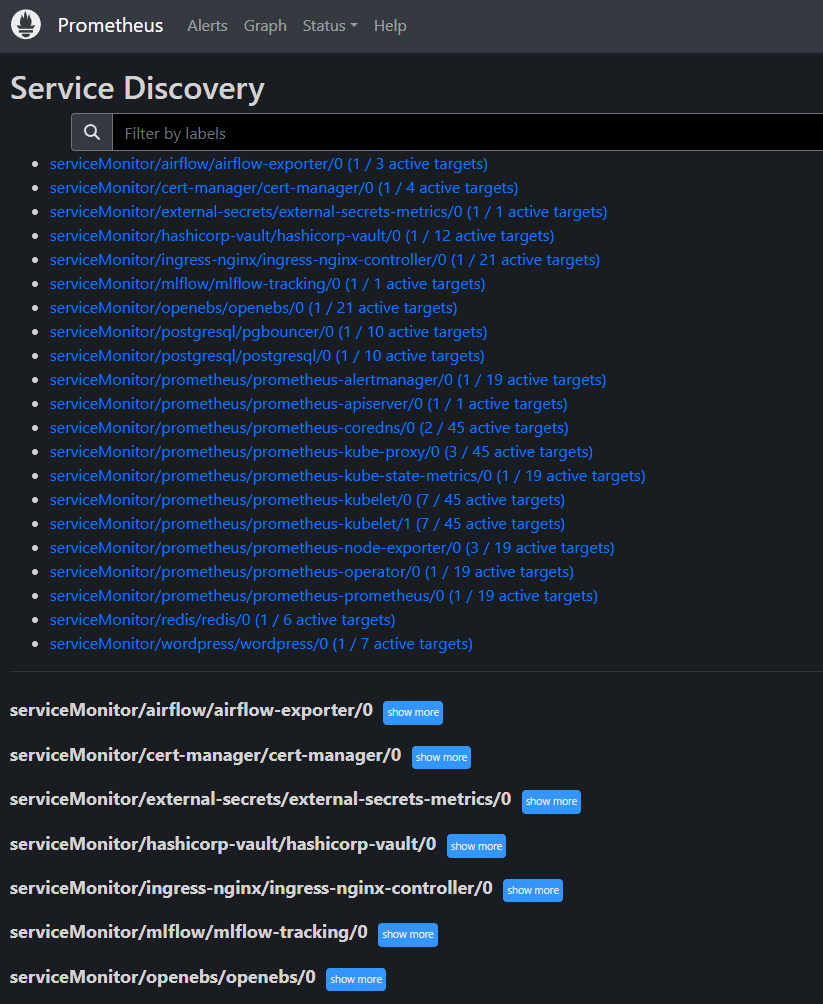
    I have spoken about Prometheus (https://prometheus.io/) in my last post so I will not repeat it.

    In terms of Loki (https://grafana.com/oss/loki/), it is easier to set up than I originally thought, given the number of components that make up Loki (12 components in total). Roughly about half of these components are core components that are needed for Loki to function (e.g. distributor, ingester), but the other half are optional supporting components that can be turned off safely (e.g. query scheduler, table manager).

    Most of the heavy lifting is done by Promtail, as it automatically discovers target logs to be scraped and pushes them to Loki. In contrast, a separate exporter needs to be setup per pod/service to make metrics visible to Prometheus, which involves a lot more efforts. That being said, Promtail has now been deprecated (https://grafana.com/docs/loki/latest/send-data/promtail/).

    As for Grafana (https://grafana.com/), it seems like a simple dashboard solution that is built mostly for observability purposes. But it impresses me in a few ways.

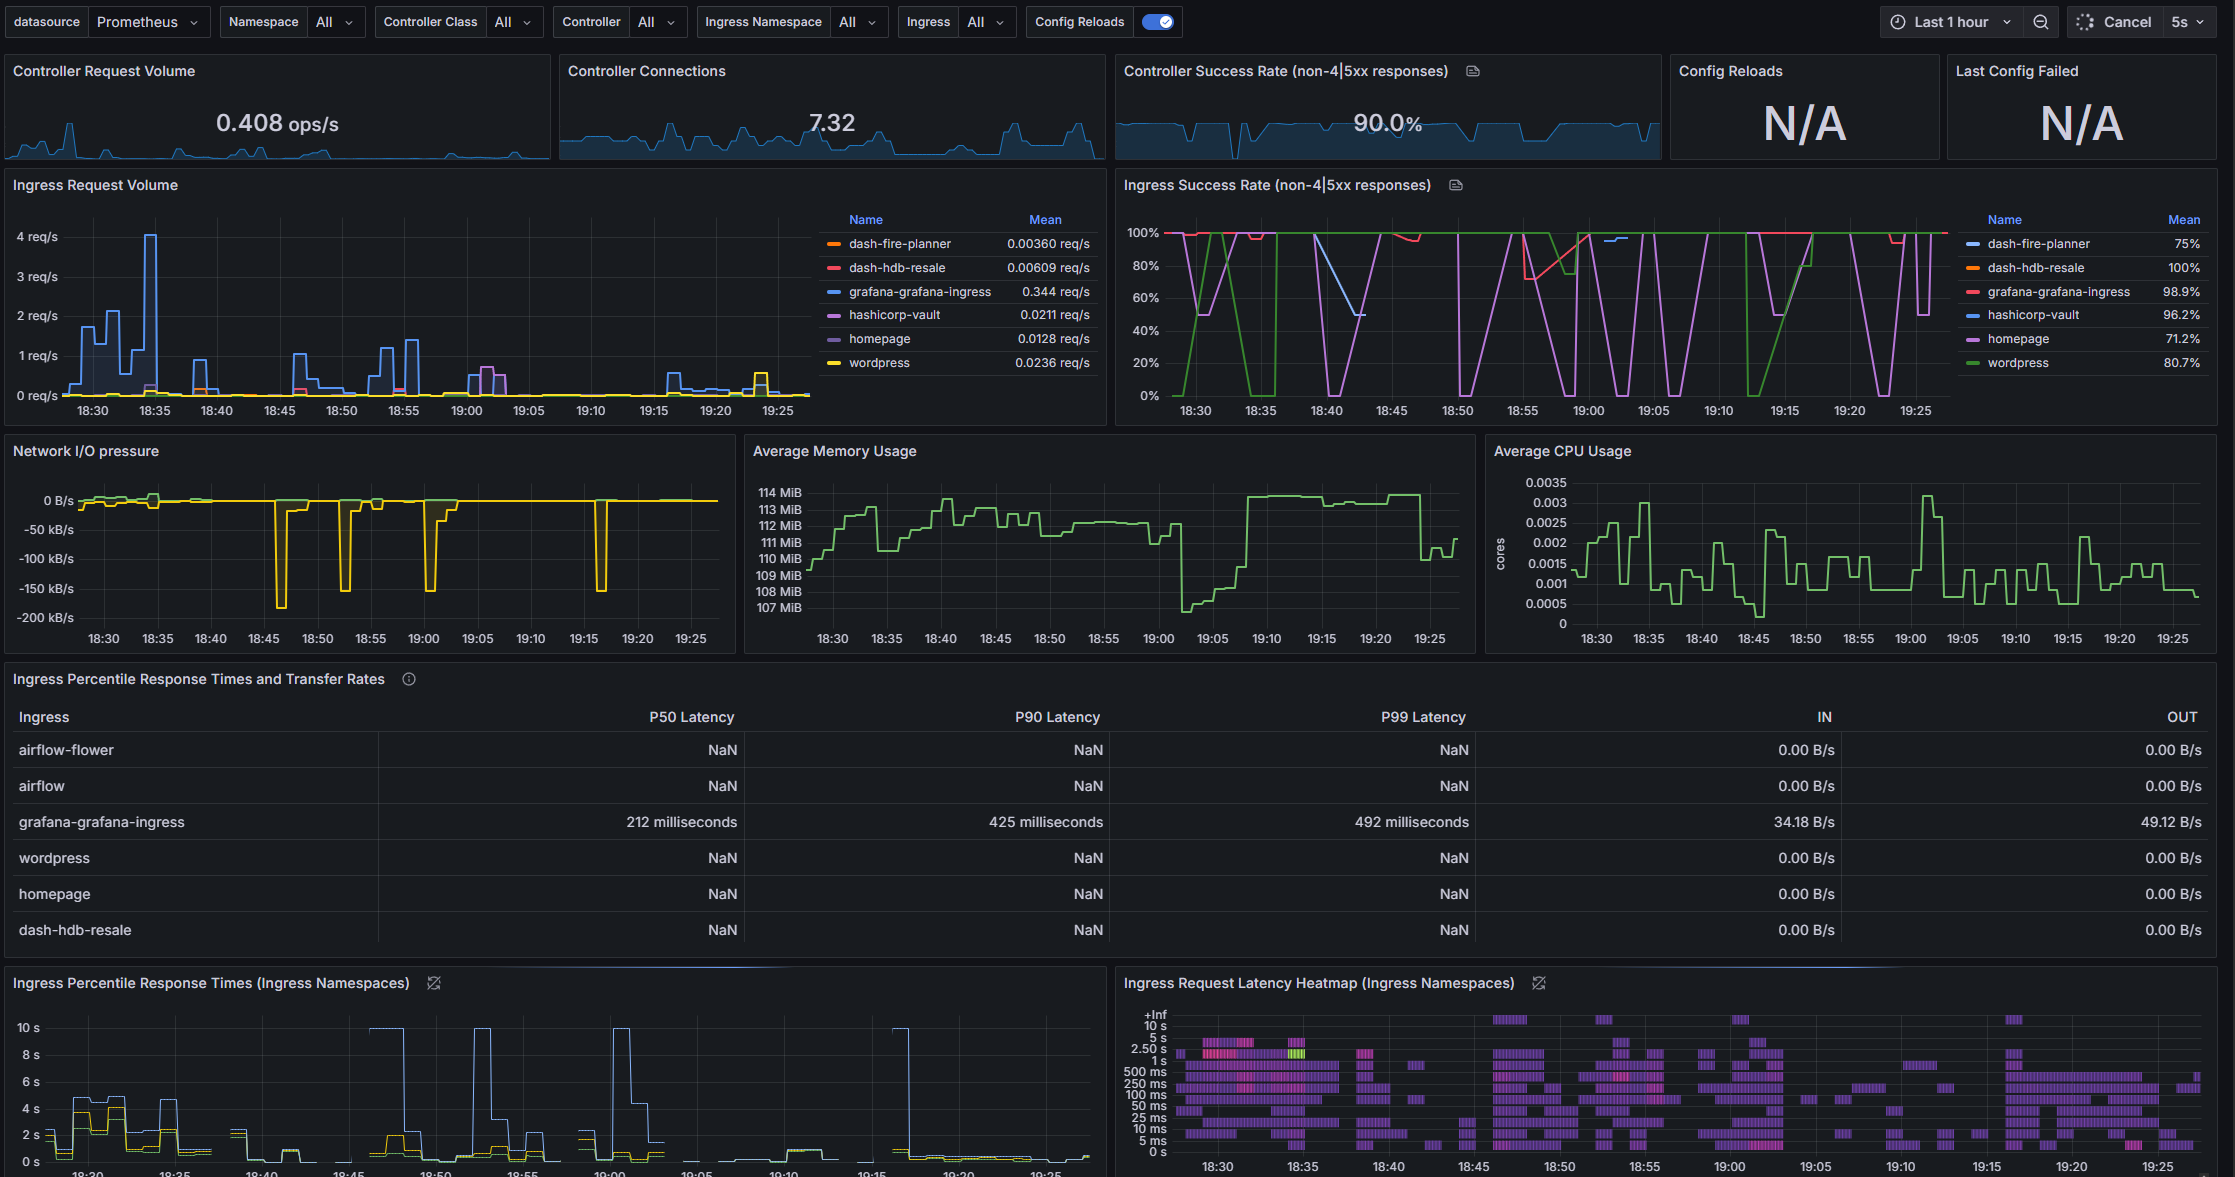
    Grafana is very efficient in terms of resource usage relative to its speeds of performance. The entire Grafana could run on less than 200Mb memory, while doing live refresh of data-heavy dashboard. Other dashboard solutions that I have worked with will not be able to cope with the same amount of data with same refresh speed without significant configuration effort (setup caching etc.).

    As I am working with Grafana operator (https://github.com/grafana/grafana-operator), it is very easy to configure data sources and dashboards in Grafana. I just have to define GrafanaDashboard and GrafanaDataSource CRDs, and Grafana will be able to pick them up automatically.

    The definition of Grafana dashboards in json format is interesting as well. It is easy to version control and could be modified in its raw text format. The only complain I have is that the public gallery of Grafana dashboards (https://grafana.com/grafana/dashboards/) is relatively limited in terms of selections. Based on my anecdotal experience, most dashboard submissions on there are outdated so not deployable out of the box.

    Besides observability for metrics and logs, another common observability implementation is to monitor internal network traffic using a service mesh like LinkerD (https://linkerd.io/). I will leave this for another day, purely due to a lack of time.

    The last piece of core supporting Kubernetes service that I will set up next will be the Kubernetes resources and volumes backup using Velero (https://velero.io/). While most of my Kubernetes deployments are stateless, I do run a few databases as well. Losing the data on them will be a disaster if there is no backup.

  • Onto Kubernetes – Part 3

    Onto Kubernetes – Part 3

    I am still working on the Kubernetes stack behind my personal website whenever I have some free time.

    The goal is still the same – to build my own personal Kubernetes-powered data science/machine learning production deployment stack (And yes, I know about Kubeflow/AWS Sagemaker/Databricks/etc).

    However my key objective now lies not with finding out whether using Kubernetes will save maintenance efforts (short answer – it does not save much maintenance efforts at a small scale), but with seeing how a best practice end state Kubernetes stack will look like and the effort needed to get there.

    So what have I been up to? Some of my time in this period has been spent on fixing minor issues that were not noticed during the initial deployments.

    Example 1, my WordPress pod is losing my custom theme every time the pod is restarted. Why is that? It is because the persistent volume seems to get overwritten each time by the Bitnami WordPress helm chart that I am using. The solution? I implemented a custom init container that repopulates the Wordress root directory by pulling a backup from S3.

    Example 2, a subset of my pods have been crashing regularly due to a node becoming unhealthy. Why is that? It is because my custom Airflow and Dash containers seem to have unknown memory leaks, leading to resource starvation on the node causing pods to be evicted. The solution? I manually set up custom resource requests and limits for all Kubernetes containers after monitoring their typical utilisations. (I have been putting off doing this for a while thinking I could get by fine, but this incident has proven that I am wrong.)

    The majority of my time has been spent on setting up proper (1) secret management (using Hashicorp Vault + External Secrets Operator) and (2) monitoring (using Prometheus + Grafana) stacks.

    On secret management. Hashicorp Vault + External Secrets Operator have been relatively easy to use, with well-constructed and documented helm charts.

    The concept behind Hashicorp Vault is relatively easy to understand (i.e. think of it like a password manager). The key trap for any beginner will be the sealing/unsealing part. The vault needs to be unsealed with a root token and a number of unseal keys for it to be functional. But if the vault instance ever gets restarted, the vault will become sealed and no one will be able to read the secrets (i.e. passwords) stored in it.

    A sealed vault needs to be manually unsealed unless you have auto-unseal implemented. However implementing auto-unseal needs another secured key/secret management platform, which turns this problem into an iterative loop. This is one area that I feel is better solved with a managed solution (which unfortunately DigitalOcean does not have at the moment).

    External Secrets Operator (ESO) works great, but it does take some time to understand the underlying concept. In short, Vault <- SecretStore <- ExternalSecret <- Secret. To get a secret automatically created, one needs to specify ExternalSecret (which tells ESO which secret to retrieve and create) and SecretStore (which tells ESO where and how to access the vault). The key beginner trap here will be the creation and deletion policy. If not set properly, secrets may be automatically deleted due to garbage collection, leading to services in Kubernetes going down (since most services rely on secrets in one form or another).

    On monitoring. Prometheus is a very well-established and documented tool, so setting it up with a helm chart is a breeze (in fact there are so many Prometheus helm chart implementations that you can definitely pick one that suits your needs). One of the ways Prometheus works in short is, Prometheus -> Prometheus operator -> Service Monitor -> Service -> Exporter -> Pod/Container to be monitored. The key beginner trap here is to think of Prometheus as just another service, but it is in fact a stack of services. The first time the Prometheus pods were spun up after installation, my nodes were fully filled with two Prometheus pods unable to be scheduled.

    The complexity of Prometheus comes from the sheer number of services, i.e. main Prometheus, Prometheus operator, alert manager and many many different types of exporters. While most services/helm charts have great support for Prometheus (i.e. already exposing metrics in Prometheus format), the challenge lies in getting these metrics to Prometheus as more often than not you need an exporter. The exporter can run centrally (e.g. kube-state-metrics exporter), run on each node (e.g. node exporter), or most often run as a sidecar as part of the pods (e.g. apache exporter for WordPress, flask exporter for Flask, postgres exporter for Postgres). Configuring all these exporters to make metrics visible in Prometheus is not hard, but definitely laborious.

    For now, I have managed to get all metrics fed into Prometheus, except for Dash that I could not find a pre-built exporter for. The next steps will be to spin up Grafana so that I can better visualise the metrics and set up some key alerting rules. With this, hopefully I can avoid having my Dash instances stuck in a crash loop due to missing secrets for one month without me knowing about it.

    After getting Prometheus + Grafana up and running, Loki the log aggregation system will be next. However the number of services that come with Loki does scare me as well.

  • Owning your career as a data scientist

    Owning your career as a data scientist

    It is the time of the year again when people start to reflect on the past year and plan for the year ahead.

    Besides planning out the next holiday or the typical I-will-hit-the-gym-more resolution, it may be worth taking some time to reflect on your career.

    It is often said that we should own our own career, but most people do not offer relevant or actionable advice for data scientists. Especially since data science is a relatively new field.

    I have set out to seek this information in an old-school way – i.e. by reading books.

    After reading a few books (including one that is specifically written for data scientists), I was mostly disappointed by them, until I chanced upon the Software Engineer’s Guidebook by Gergely Orosz.

    You can tell from the name of the book that it is written for software engineers, but I find most (if not all) advice in there apply for data scientists as well.

    The tone of the book is direct and easily digestible, without obfuscation by languages you typically encounter in a corporate environment.

    Amongst many other topics, it talks about how to navigate performance reviews & promotions, the importance of soft skills & longer tenure as you rise in seniority, and how to thrive in different companies.

    The most important takeaway for me is (in my own words) – A successful career path is not a linear journey, and it is not about drawing the highest paycheck or having the fanciest job title. Do not overlook the seemingly small things along the way that will help you grow towards where you want to be over the long term.

    The book did not tell me the destination of my career path, but it did give me tools to help me reach there sooner.

  • Data Science – Profit Centre vs Cost Centre

    Have you ever wondered how can we justify the business values created by data science? Is there any difference between a profit centre setup (i.e. client/stakeholder funded) for data science versus a cost centre setup (i.e. centrally funded)?

    For any business function in a company, it is important for the business function to be able to justify the value that it brings to a company.

    This is no different for the data science function in a company.

    For data science function that operates as a profit centre, such as in data science consulting and tech product development, the business value is relatively easy to justify by looking at the share of revenue/profit that can be attributed to outputs from data science.

    E.g. A consulting project that lasted 6 months with 3 billed FTE (one of which is a data scientist) brought in an EBIT of $300k, so we could attribute $100k to the value that was contributed by data science.

    In most conventional companies, the data science function operates as a cost centre. The business value provided by a cost centre can be indirectly justified by the value of the business processes that it supports.

    However data science as a cost centre differs from most other cost centres. This is because data science is a new field whose purpose is (almost) entirely to improve efficiencies in existing business processes owned by other functions. This means that a data science function can only justify its business value if it can help other business functions justify their values more effectively.

    E.g. A data science team created a tool that automatically optimises scheduling of worker shifts, reducing the time needed for the planning team to manually schedule shifts from 10 hours per week to 1 hour per week. Assuming a FTE costs $50k per year (~$21.4 per hour), this leads to ~$10k of cost savings per year contributed by a data science solution.

    Regardless of whether operating as a profit centre or a cost centre, the need to justify business values from data science is only going to increase in the future. Especially when the AI hype wave recedes.

  • Brief Review on GitHub Copilot

    Brief Review on GitHub Copilot

    Time really does fly. It is now almost the end of 2024.

    To close off 2024, I will be writing a post on a different topic each every week until the new year arrives.

    My first post is about GitHub Copilot.

    I’m rather late to the game in terms of adopting GitHub Copilot for my personal projects.

    But it has really blown me out of the water so far.

    Copilot helped me navigated the complex territory of Kubernetes/Helm YAML manifests, but was less helpful when I’m working with polars.

    Some quick pros and cons are listed below.

    Pros:

    ➕ Amazing context search ability based on currently opened files.

    When asked a question, it will automatically search for relevant parts in opened files in VS Code to help produce a more relevant answer. This means it can suggest functions/methods from libraries that you are using and variable/column names that follow your convention.

    ➕ Great at explaining hard-to-search technical terms (e.g. special characters in Bash, regex).

    In the olden days without LLM, it is really hard to search for special characters on Google especially if you do not know what they are called in English. But Copilot has no problem breaking down a string of special characters and explaining them one by one. In fact, Copilot taught me about heredoc in Bash.

    Cons:

    ➖ Not useful on newer or rapidly changing libraries (e.g. polars).

    Copilot does suggest wrong syntax from time to time, but it suffers the most when asked to work with newer or rapidly changing libraries. With polars, it kept on suggesting older APIs, e.g. with_column and groupby, instead of with_columns and group_by.

    ➖ Can suggest convoluted solutions when simpler ones exist.

    To illustrate this using a recent example that I remembered. When asked on how can I access a value in a polars DataFrame, it suggested selecting a column, converting it into a series before accessing the value via index. Although in reality, the value can be accessed directly with square brackets or item().

  • Onto Kubernetes – Part 2

    Onto Kubernetes – Part 2

    About 2 months ago, I started migrating my entire personal stack onto Kubernetes from regular virtual servers.

    So what has happened in the meantime? Have I freed up more operation maintenance time to do more interesting data science development work yet?

    Unfortunately the answer is no, at least for now.

    It turns out that migrating Airflow and MLflow onto Kubernetes is harder than I thought. This is because both of these tools require multiple backend services to run smoothly, including a relational database (where PostgreSQL is used) and an in-memory database (where Redis is used).

    Previously to speed up my development progress, I had been using managed instances of PostgreSQL and Redis offered by DigitalOcean. They are extremely easy to set up and I was able to start using them within minutes.

    However I eventually ran into weird runtime issues in Airflow and MLflow that ultimately boiled down to specific configuration issues within PostgreSQL and Redis. While managed services are easier to get started, debugging and customising them are typically harder due to restricted access to certain logs and backend configurations.

    So I told myself, if I can work with managed PostgreSQL and Redis, how hard would it be to self-host them directly in Kubernetes, which would give me the freedom to customise them to work with Airflow and MLflow as needed?

    Or so I thought.

    I spent the next few days on properly exposing PostgreSQL and Redis ports via ingress-nginx, then another few days on setting up pgbouncer connection pooling for PostgreSQL, then another few days on setting up Airflow environment to work with custom DAG package, then another few days on making sure all services are interacting correctly with the new self-hosted PostgreSQL and Redis instances.

    After many “few more days” than I expected, my entire personal stack is finally fully migrated onto Kubernetes (components as shown in the attached diagram).

    So what’s next you asked? Is the platform all set and ready to go?

    Not yet, unfortunately. To make sure the Kubernetes-based platform can survive for longer with minimal maintenance, I will be setting up proper secret management, monitoring solution and CI/CD integration next.

    Another “few more days” to go eh?

  • Technical Debt vs. Mortgage: A Data Science Homeowner’s Guide

    (I used chatGPT to help me make the written content more “engaging” and “LinkedIn-like”, so keeping the 2 versions below for comparison purpose.)


    [ChatGPT rewritten version]

    Building a minimal viable product (MVP) in data science is like buying your first home with the maximum mortgage.

    It’s often necessary to move quickly and show business value (aka “get a place to live in”), but in doing so, we often accumulate a mountain of technical debt—just like a hefty mortgage.

    But here’s the thing: While you’re using the data science product (or living comfortably in your home), don’t forget to pay down that technical debt—just like you wouldn’t skip your mortgage payments!

    Sure, you might get by without addressing it for a while, but trust me, no one wants to be hit with a foreclosure notice or an unmanageable pile of tech debt later on.

    The key takeaway? Keep building, but always have a plan to pay it down. Your future self will thank you!


    [Original version]

    Building a minimal viable product in data science is like buying your first home using maximum mortgage.

    It is often a necessity to do this to show business values (get a place to live in) fast, which means accumulating a huge amount of technical debt (mortgage) along the way.

    However we should not forget that while using the data science product (or living in your home), it is important to pay down the technical debt (mortgage) periodically.

    While it may be possible to get away from paying down the technical debt for quite some time, but I would definitely not recommend anyone skipping on their mortgage payment!

  • Onto Kubernetes

    Onto Kubernetes

    I have always been told that using Kubernetes is too complex and overkill for most purposes.

    That has put me off for years, before I finally decided to take the plunge into the Kubernetes world 2 months back, embarking on a mission to migrate my entire personal stack onto Kubernetes.

    The tip-over point for me arrives when it becomes increasingly hard to manage the 4 virtual machines, 7 applications, and 10+ containers. The manual management of infrastructure and resources took up all my free time, without leaving much time for doing actual developments.

    Heeding the warnings of others, I approached Kubernetes cautiously, spending the first month reading a book on the basics (Kubernetes in Action by Marko Luksa).

    By the end of the first month, I thought I was ready, as I had experience with container technology and all my applications were dockerised. So I spun up my first-ever Kubernetes cluster (managed service obviously) to begin my migration.

    I ended up spending another 2 weeks fighting with helm and helmfile (as I swore to work off manifests only, without relying on command lining everything).

    And another 2 weeks to get my web services accessible from the outside (e.g. load balancer, TLS – why are some Kubernetes settings done via annotations?).

    May be I was initially too optimistic, but at least now I finally managed to get my key services to run smoothly on Kubernetes.

    So what is my take on Kubernetes for now?

    The complexity seems to be manageable, as long as you have some knowledge of system admin and container technology. Without that knowledge though, I can see how hard it will be to debug any deployment that goes wrong, trying to dig through layers upon layers of abstraction provided by Kubernetes.

    In terms of cloud computing costs, it was almost exactly the same pre and post-Kubernetes migration despite using a managed Kubernetes service.

    Hopefully, this will not become my famous last words down the road.

  • 3 Micro Learnings Over the Weekend

    3 Micro Learnings Over the Weekend

    3 micro learnings over this weekend :

    (1) cloudpickle works better than pickle in storing trained sklearn models

    Have you ever proudly saved a trained sklearn model to be used for serving elsewhere, only for it to complain of missing imports or classes when you try to load it?

    Other than making the imports or classes available in the model inference environment, I realise cloudpickle allows me to store the necessary model classes together with the trained model.

    cloudpickle.register_pickle_by_value to the rescue.

    (2) the purpose of using SQLAlchemy is to not write raw SQL codes

    I have been using SQLAlchemy with pandas to interact with various databases for years.

    However for some reasons that are unknown even to me, I never fully realise that SQLAlchemy is an ORM (object relational mapper) that helps abstract SQL operations into Python codes regardless of the underlying SQL dialect.

    And I had been defining SQL tables manually without relying on SQLAlchemy’s MetaData and Table constructs.

    (3) chatGPT is amazing in writing boilerplate code

    I have to write tests for our local Airflow dev instance.

    Instead of trying to dig through tutorials to find how to instantiate an Airflow DAG for testing purposes, I asked chatGPT to write them for me.

    Granted I need to do minor modifications to the tests written by chatGPT, but it saved me at least 30 mins in googling for the boilerplate codes required.

  • New additions to family – Traefik and Airflow

    New additions to family – Traefik and Airflow

    Added Traefik and Airflow to the family of services behind my personal websites.

    Traefik – an amazing modern reverse proxy that integrates extremely well with docker containers, saving me a lot of troubles in manual configurations (looking at you nginx).

    Traefik makes it trivially simple to redirect internet traffic to multiple Dash docker containers, by just adding tags to docker compose services.

    Despite the flexibility offered by Traefik, I feel more comfortable using nginx as the first layer reverse proxy as it has worked very well for me for a long time.

    Airflow – an industry standard tool to schedule workflows. I finally have a proper tool to run and schedule long-running tasks, without having to resort to manual executions.

    Setting up DAGs to run on Airflow is relatively easy. But what I did not expect is the complexity in setting up Airflow infrastructure. In essence Airflow consists of not just a single service, but multiple services that cross talk with one another.

    Configuring them took some time, but official Airflow docker image has greatly simplify this process. That being said, standing up Airflow almost doubled my shoestring cloud budget.

    Now, time to write and get some DAGs running!